The numbers, compiled by Sciensano, relayed unfiltered by the media and used by our government for political purposes, make our heads spin daily. Annès Bouria gives us however in a weekly way a very different interpretation.
Analysis is based on the Sciensano epidemiological report dated 09/11/2020.(1)
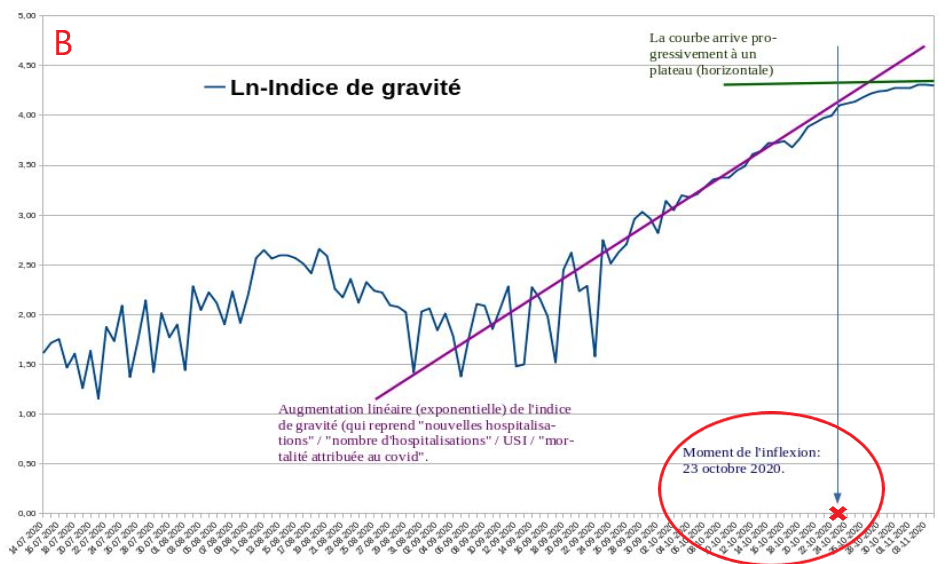
Below we will analyze in A, the epidemiological graphs of covid published by Sciensano, in order: 1 the number of cases, 2 and 3 hospitalizations, 4 patients in intensive care, 5 mortality.
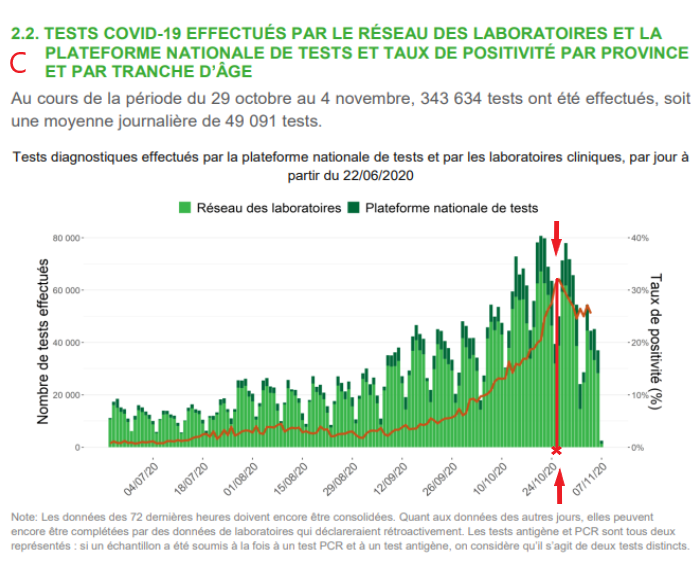
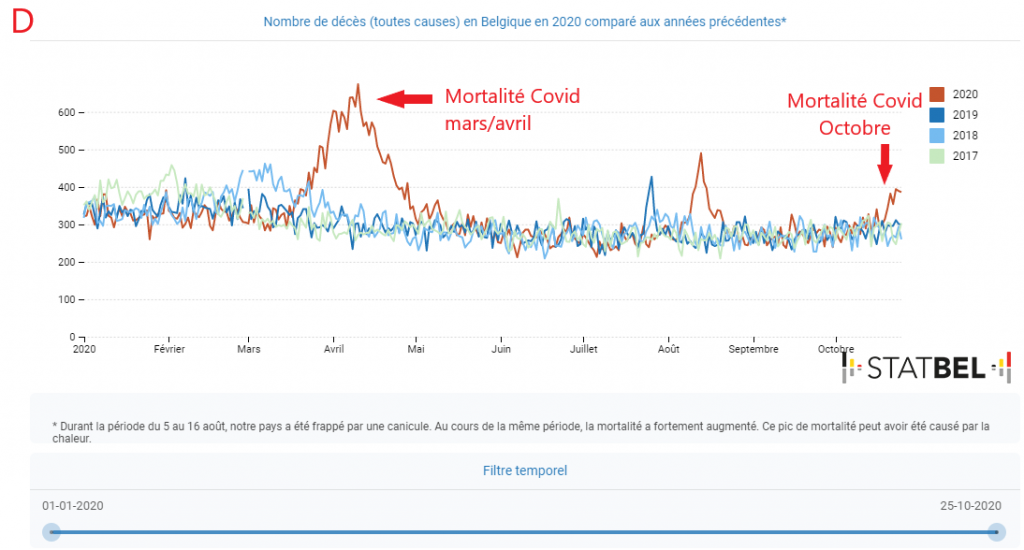
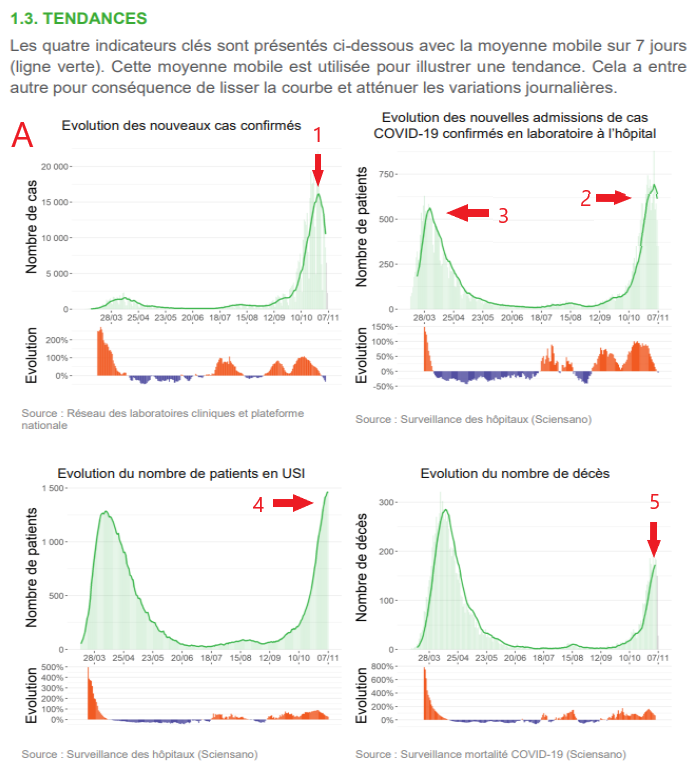
Also, in appendix, we have: in B, a graph published by Christophe de Brouwer, Professor at the School of Public Health of the ULB, representing the evolution over time of the Severity Index taking into account 4 variables (new hospitalizations, hospitalizations, patients in ICU and Covid mortality) expressed in neperian logarithm In C, A graph of the PCR test positivity rate from the Sciensano report of 09/11/2020 (see footnote 1). In D A graph of overall mortality data from 2016 to 2020 prepared by Statbel(2). And finally in E, a graph of the frequency of identification of the « Spanish » variant of Sars-Cov2 in samples taken from patients in various European countries from the study of Hodcroft et al.(3)
To know a priori the proportion of cases considered serious, the index consists in reporting the average number of daily admission of 620 patients to the 10500 positives, that is to say 5,9 % of the positives requiring a hospitalization. A figure in relative increase, which is due to the fact of having reached the peak of this epidemic episode, as we will demonstrate later.
It should also be remembered that this peak of positives is not at all comparable to the one in March-April when only patients who arrived at the hospital in very advanced stages were tested. Today, the testing policy is still very broad, with more than 400,000 tests performed the previous week (week 44). The number of PCR tests is approaching 60,000 per day and nearly 1.5 million tests were performed during the month of October. During this massive testing campaign, the decision to stop testing asymptomatic people was a good one, because since this summer, the testing policy was not targeted and most of the healthy carriers whose contagiousness is not established were detected(4).
Let’s take stock with some figures: covid patients currently occupy 6,900 beds, which is about 19% of all available clinic beds nationwide (37,000) or 86% of the 8,000 beds potentially available for covid cases(6). The 620 average daily hospitalizations classified as « covid » for the week of November 1–8 represent less than 52% of the approximately 1200 daily hospital contacts for respiratory complaints according to 2017 data from FPS Public Health(7). For an average of 620 admissions per day, approximately 550 discharges are recorded. The number of discharges is now equal to the number of admissions, which is a sign of an inflection in the hospitalization curve.
It should also be noted that the distribution of hospitalizations is not homogeneous: Brussels and Wallonia account for nearly 70% of new admissions.
The threat, exposed by the experts, which led the political authorities to tighten the sanitary measures, is that of the saturation of the hospitals. Although the situation is indeed very tense in the covid units, the phenomenon of hospital saturation during periods of increased seasonal respiratory illnesses is unfortunately not new, there were episodes of winter saturation in 2017 as well as in 2019 during the influenza epidemics(8)(9). If we want to probe the reasons for this chronic saturation of hospitals, it is important to take into account the clear decrease of available beds for acute conditions in hospitals over the last 30 years, from more than 55,000 to 37,000, despite the increase of the population and its aging! It would also be interesting to question the authorities to know what they have concretely put in place in terms of hospital resources to deal with the situation that they have been dreading for more than 6 months.
In addition to the fact that the situation in hospitals and even in outpatient clinics is heavily burdened by « covid » protocols that prevent medical staff from concentrating on their primary function, which is to provide care(10)(11)(12)The most important point to highlight is that there is absolutely no policy for the outpatient management of patients with covid. In this epidemic, general practitioners who are supposed to be on the front line are out of the running. According to official recommendations, they have only one course of action to follow for symptomatic positive cases: isolation, taking paracetamol and, in extremis, referral to a hospital if the patient’s condition deteriorates(13). In the history of medicine, this is unheard of! Wouldn’t this policy of not taking care of patients be, among other things, the reason for the over-occupation of covid hospitals?
Finally, there are other important points to add to this obvious lack of consistent public health management. It should be noted that during the week of the lockdown, some hospital services are abnormally under-frequented for this period, especially pediatric services(14). The FPS Public Health even published a notice on social networks on November 6 encouraging patients not to hesitate to contact their GPs or hospital specialists because they were seeing fewer patients than usual(15). Moreover, these repeated confinement situations mean that telemedicine, although extremely questionable in terms of reliability and ethics, is becoming the norm(16).
I would like to emphasize that these are false positives in the diagnostic sense of the term and not in the technical sense. The test does detect a trace of the virus, but this does not give us any clear information about the etiology of the patient’s clinical condition.
The difficulty lies in clearly distinguishing seasonal respiratory diseases from covid, which is not possible to establish with any certainty.
Are all patients admitted and listed as « covid » sick because of SARS-COV2 infection, or are they suffering from other respiratory infections while carrying SARS-COV2 without SARS-COV2 being the major cause of their clinical condition?(18)
It is important to note that according to some studies, depending on the sensitivity of PCR tests, up to 90% of positive tests for SARS-COV2 have no medical significance when systematized to this extent. Indeed, a New York Times article reports this very high proportion of clinically irrelevant positives when the number of PCR amplification cycles (CT) exceeds 30(19). And in Belgium, the number of PCR amplification cycles (CT) ranges from 30 to 35 (see nbp 17).
If the CT cycles of the PCRs performed are too high, the tests are hypersensitive and therefore cannot determine, even if positive, whether the patient is indeed sick with covid.
All these patients labelled « covid », whether or not they really suffer from this disease, will in fact cause a rapid saturation of the hospital system because of the cumbersome protocol of their care.
Add to that the fact that some patients admitted for anything other than covid are tested for PCR, and if they are positive, they are listed as « covid hospital admissions »!
As for the saturation of the intensive care units in Belgium, unfortunately this is not an exceptional situation either. According to Dr. Philippe Devos, intensivist at the CHC Liège, during the peak of the flu epidemic in January/February 2020, the ICU bed occupancy rate was over 90%! And this by patients who developed complications from severe influenza(21).
ICU capacity is well stretched by the cases listed covid. But what is imperative to highlight is that the clinical covid pictures are much less gloomy than in March/April. The proportion of ventilated patients has decreased since the last episode in March, and it is indeed the patients on ventilators who have the worst vital prognosis and who « clog up » the ICUs because their management is spread over several weeks, which reduces the « turn-over » capacity of the resuscitation passages. Indeed, this improvement in terms of the « severity » of cases is probably due to better management of patients upstream thanks to a more thorough knowledge of the disease as well as the introduction of treatments such as anti-coagulants, corticoids or oxygen therapy which reduce ICU visits and their severity.(22)
It is clear that management protocols have changed and that intubations are only done as a last resort. This highly invasive medical technique constituted more than 80% of the management of covid patients in the ICU during the April epidemic peak, compared to about 55% today. And this is confirmed by a lower covid mortality at the present time.
As for the « instantaneous » lethality rate, we are at 1.65%. A relatively increased figure which, like the relative increase in the hospitalization rate, is due to having reached an epidemic peak with a lag of about two weeks between the peak of case detection and mortality. To get a clearer picture of the apparent case fatality rate for this episode, the number of deaths can be plotted against the number of cases recorded since mid-September. Approximately 375,000 people tested positive during this period for a total death toll of 2,600, bringing the apparent case fatality rate for this fall episode to 0.7%. A case-fatality rate consistent with the actual case-fatality rate of covid found in the literature according to WHO estimates.(23)
Fortunately, the increase in covid mortality was rather small compared to the other indicators, which is a major indication that this episode was less severe than the March/April peak. So I refer you to Graph D, which is the general mortality data: there is only a notable but relatively small excess of general mortality over the previous three years up to October 25 with respect to this fall 2020 epidemic episode. Although the mortality of this episode will probably still stand out in the days following October 26, it will be out of proportion to the March/April peak.
The epidemic peak of this autumnal episode seems to have been reached around October 23, as can be seen on graph B published by Christophe de Brouwer, Professor at the School of Public Health of the ULB, which represents the covid severity index taking into account 4 variables (new admissions, hospitalizations, ICU patients and covid mortality) as a function of time. The inflection of this severity index, which accounts for several parameters that are often shifted over time, takes place at the end of week 43 (October 19 to 25).
This is fully corroborated by the Sciensano graph in C where a major parameter in the quantification of an epidemic episode, namely the covid test positivity rate, peaks shortly after October 23.
While it is commonly accepted that there is usually a 10 to 15 day delay between sanitary measures taken to limit the spread of Sars-Cov2 and its expected effects(24), the impact of this new containment on the evolution of the epidemic is highly debatable, if not absolutely null. At most, one could attribute a possible effect of the measures taken at the beginning of October, but this remains to be demonstrated. Nevertheless, the most coercive measures taken after the second half of October cannot be the cause of the inflection of the indicators observed at present. Most obviously, this autumn epidemic peak was expressed through the various indicators in the form of a banal bell curve on which the restrictions imposed on the population probably had little effect.
If it is commonly accepted that there is generally a 10 to 15 day delay between sanitary measures taken to limit the spread of Sars-Cov2 and its expected effects, the impact of this new containment on the evolution of the epidemic is highly debatable, if not absolutely null
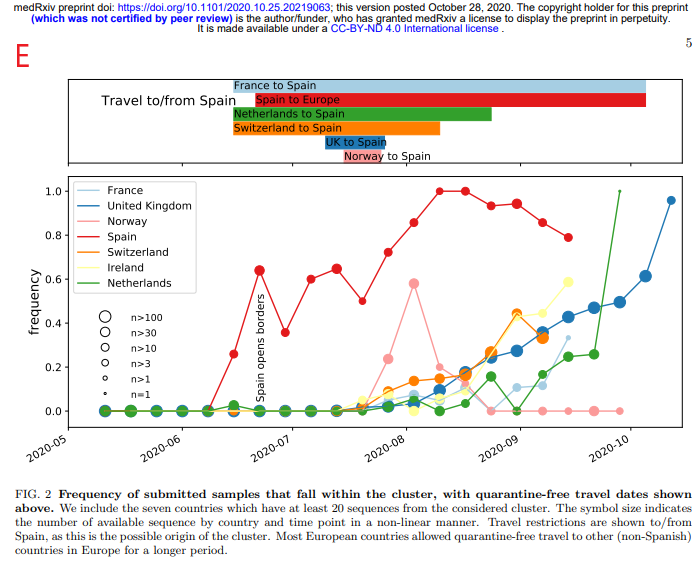
What is the origin of this epidemic resurgence? One hypothesis that seems to be confirmed by various epidemiological findings and studies is that Western Europe was hit by a variant of Sars-Cov2 that originated in Spain and then spread through other countries in late summer(25) (see also nbp 3).
Below, to illustrate the phenomenon, a graph of the frequency of identification of the variant in question in samples taken from patients in various European countries.
Hospitalization rate (number of hospitalizations per identified case): 5.9%.
Proportion of patients hospitalized in intensive care: 21%(1.3% of cases)
Proportion of resuscitation patients on ventilators: 57%(0.74% of cases)
Instantaneous case fatality rate (number of deaths per case identified): 1.65
Apparent case fatality rate for the fall episode (since September 15): 0.7
Median age of death: 79 years
*Average over the week from 01/11 to 08/11. The first 4 figures are relatively increasing due to the time lag between the peak of case detection and the peak of hospitalizations, ICU patients and mortality.
We can now see the beginning of an inflection in the indicators of hospitalizations and mortality in the wake of a peak in the detection of « cases » (PCR positive). The beginnings of this inflection and, even more so, this epidemic peak took place during week 43 (from October 19 to 25), well before the expected effects of the most coercive measures taken by the authorities at the end of October.
It seems very likely that SARS-Cov2 takes on a seasonal pattern and that a particular variant of SARS-Cov2 is causing this fall epidemic peak. Contrary to what the media-political doxa would like to distill, this upsurge of the epidemic is not due to a « relaxation of the citizen’s behavior » but to a classic, identifiable and quantifiable evolution of the dynamics of the viral epidemic.
In any case, it must be admitted that the effectiveness of the measures taken since mid-October are extremely questionable on a scientific level. Not to mention their medical and socio-economic consequences, as well as their democratic and constitutional illegitimacy. In a reckless headlong rush, our government, supported by a unanimous and dogmatic expertocracy, has plunged the people into a new confinement with heavy consequences, without really analyzing the situation or waiting for the evolution of the epidemiological situation.
Contrary to what the media-political doxa would like to distill, this upsurge of the epidemic is not due to a « relaxation of the citizen’s behavior » but to a classic, identifiable and quantifiable evolution of the dynamics of the viral epidemic
It should be remembered that, firstly, the effectiveness of containment has not been demonstrated. The countries that have applied this measure drastically are among those with the most catastrophic per capita mortality rates in Europe: Belgium, Spain, Italy, the United Kingdom and France. Add to this that a seroprevalence study conducted by the Spanish authorities on more than 60,000 subjects showed that confined people were more contaminated than people who continued their professional activities in the essential sectors. Data, confirmed by another Italian study, which may legitimately cast doubt on the containment strategy as a solution to the epidemic(26)(27).
And secondly, the collateral damage in terms of health of such a strategy seems to tip the balance in favor of risks rather than benefits. As shown by several British studies which highlight an unprecedented increase in late diagnosed cancers and heavy consequences on untreated pathologies such as cardiovascular accidents. Not to mention suicides, depression and the resurgence of intra-family violence(28).
Moreover, the phenomenon of saturation of public hospitals seems to be due more to the chronic lack of hospital resources than to the intrinsic seriousness of covid (in view of the proportion of serious cases as well as the current low lethality). Nevertheless, the authorities persist in a dialectic that makes the citizen feel guilty and makes him/her solely responsible for the evolution of the epidemic as well as for hospital tensions. This is an extremely misleading political strategy and is dishonest in terms of transparency regarding the complexity of the ins and outs of this health crisis.
What is the legitimacy and the real impact of the governmental measures recently applied, given the favorable evolution of this epidemic episode?
We persist in the opinion that it is imperative to put in place a proactive and well thought-out health strategy with regard to the risk/benefit balance (not only from a health point of view, but also from an economic and social point of view).
It should:
Finally, the most important remark: What is the legitimacy as well as the real impact of the recently applied governmental measures given the favorable evolution of this epidemic episode?
This question deserves to be brought to the various ministries having the management of the health crisis as a prerogative, as its involvement is of major importance for the daily life and the future of the citizens.
Thank you for reading.
Annes Bouria
Pharmacist — Member of the Transparency-Coronavirus collective
https://www.transparence-coronavirus.be/