
Certainly, the myth of equal opportunity had long been destroyed. The work of sociologists in the 1960s and 1970s had already left no doubt1 : despite several decades of « massification », the school remained profoundly unequal. Depending on the social environment in which we are born, on the education of our parents, on their profession and their income, we do not have the same probability of success in school and access to a diploma. This belief had become so commonplace that, during the 1980s and 1990s, it was no longer considered necessary to support it with regular statistical studies. At least in Belgium. At the end of the 1990s, the only data available in the scientific literature dated back to 1980.
Then came PISA. This is the nice name given to a large international survey of students’ academic skills at age 15: » Program for International Students Assessment« sometimes translated as « Programme for International Student Assessment « .
Initiated by the OECD, this study has been much talked about. Questions have been raised, for example, about the relevance of international rankings that purport to compare the « performance » of countries in mathematics, reading or science. Indeed, despite what the study designers promise, it seems difficult to imagine that students’ ability to answer test questions is completely independent of national curricula.
On theother hand, it is reasonable to assume that students in the same country — or in the same federated entity with its own education system — should be equal in the PISA tests. At least if this education is really democratic. Therefore, even if the average results of the countries must be apprehended with great caution, the differences between students within a country or a region are really significant and, therefore, comparable from one country to another.
When the results of the first PISA tests were published, the Belgian press, both Flemish and French-speaking, made a big deal of the gap between Flanders at the top of the ranking and the French-speaking Community lagging miserably at the bottom of the European pack. On the other hand, with the exception of specialized circles, another reality was discreetly ignored: our two linguistic communities were among the champions of social inequality at school. This finding was confirmed by four successive PISA surveys in 2000, 2003, 2006 and 2009.
MEASURING INEQUALITY
There are various ways to measure the equity of education systems. For example, in our first graph, we compare the PISA test scores of two extreme groups: the upper and lower socioeconomic quartiles. To simplify, we could say: the 25% of students from the richest families and the 25% from the poorest. To understand exactly what this indicator means, it is worth recalling that PISA expresses student performance by means of scores ranging from 0 to 1000. They are calculated in such a way that two thirds of the students (from all countries) obtain a score between 400 and 600 points and that the international average is just equal to 500 points(1). On this scale, the Flemish Community has an average score of 553 points in mathematics (PISA 2003), while the French Community has only 497 points. There is therefore a gap of 56 points between the two communities (2).
« Within each of Belgium’s linguistic communities, the differences between « rich » and « poor » are significantly greater than the differences between the north and south of the country. »
The data in Figure 1 show that within each of Belgium’s linguistic communities, the differences between « rich » and « poor » are much greater than the differences between the north and south of the country: 138 points difference in the French Community, 123 points difference in the Flemish Community. It is worth noting that the two Belgian education systems are at the very bottom of this ranking. Only Germany is doing about as badly as we are. Note also the position of the Nordic countries, in particular Finland, which are well ahead with a gap of only 71 points.
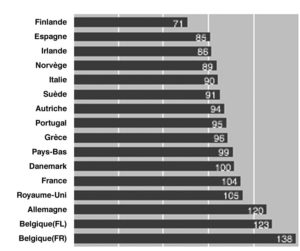
Figure 1: Difference in mathematics performance between the extreme socio-economic quartiles
The gap in educational outcomes between the « richest » 25% of children and the « poorest » 25% is higher in Belgium than anywhere else in Western Europe (PISA 2003).
What is particularly worrying about the Belgian situation. Regardless of the indicator used, regardless of the year of testing, our country, across all communities, is consistently ranked among the worst performers in terms of educational equity. And very often, « among the worst », simply means: « the worst ».
SEGREGATION
The major characteristic of Belgian education (French or Flemish) in terms of equity is that there are not only large differences between students, but also between schools. Social inequality in schools takes the form of social and academic segregation.
This is shown first in Figure 2, which represents the variance in average school performance. We are the country in Western Europe with the highest differences between schools. Here again, the contrast with the Nordic countries is striking, since there the differences in « level » between schools are practically non-existent.
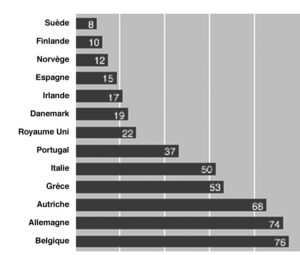
Figure 2: Variance in average school performance
We are one of the countries with the greatest differences in performance between « good » and « not so good » schools. (PISA 2003)
The two graphs in Figure 3 summarize the essential difference between Belgium and a country like Finland(3). Each school is represented by a point, along two axes. The horizontal axis is the school’s average socioeconomic index: the further to the right a school is on this scale, the more its students come from « rich » families. The vertical axis is the average level achieved in mathematics by students at this school.
In Belgium, socially unequal schools with unequal performance. In Finland, socially mixed schools with good performance.
What do we see? On the left (in Belgium), a cloud of points clearly aligned along an ascending diagonal: the more the school recruits from higher social backgrounds, the better the results. On the right (in Finland), on the contrary, we have much more clustered points, but without any clear trend: here the social determination of the schools’ results is weak.
On the left (in Belgium), the schools stretch between the values ‑1 and +1 of the socio-economic index (horizontal axis). On the right (in Finland), schools are much more clustered around the central values (most are between ‑0.3 and 0.8). This means that there is much less social segregation in Finnish education; their schools are more mixed.
It should be noted that the vertical dispersion of points is much lower in Finland than in France: whatever the social origin of the students in Finnish schools, the average performance of these schools in the PISA tests is roughly equivalent.
SEGREGATED STREAMS
Social inequality is not only expressed in differences in performance in math, reading or science. It can also be seen in a pernicious form of social segregation: the streams. From the age of 12, and even more so from the age of 13–14, our secondary school directs students to three clearly hierarchical forms of education: transitional education, technical qualification education and vocational education.
It is sometimes argued that this orientation is based on students’ abilities or choices. In reality, it is an essentially social selection.
In Figure 5, 15-year-old students were divided into ten social categories (ten « socioeconomic deciles »). The top decile includes the « poorest » 10% of students and the top decile includes the richest 10%. Next, students in each decile were subdivided into four groups, based on the educational track in which they were enrolled. What we observe is that the major secondary education streams really do act as social filters. While it is extraordinary for a child in the upper classes to be in vocational education at age 15, in the lowest socioeconomic decile, barely one child in ten is still in general education.
Nico Hirtt