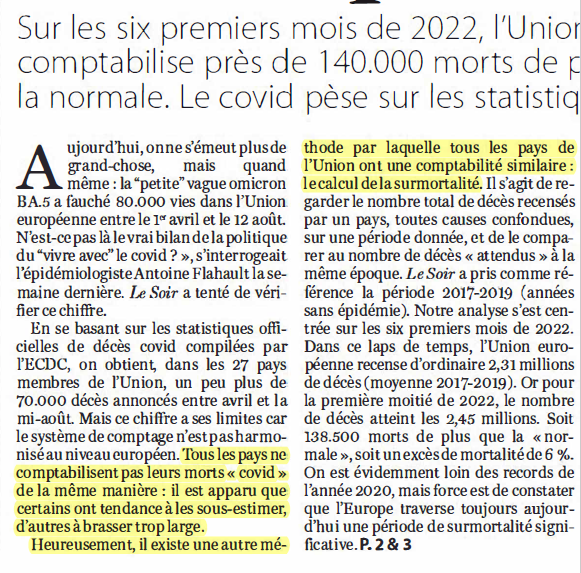
Alors que le quotidien belge Le Soir publiait un article en pages 2–3 (les plus chères en terme publicitaire après la première page) avec une accroche en couverture: « Le Covid augmente encore la mortalité en Europe », nous avons pris contact avec Christophe De Brouwer. Ancien président de l’École de Santé publique de l’Université libre de Bruxelles, il analyse depuis plus de deux ans les chiffres Covid et les mensonges médiatiques et politiques sur leur interprétation. Ses conclusions sont sans appel : cet article de Xavier Counasse est une véritable fake news, comme les journaux mainstreams eux-mêmes aiment les appeler. Nous ajoutons qu’en plus de propager peurs et angoisses, ce genre d’article sème littéralement la mort.
La semaine dernière, un quotidien mainstream, en première page, nous a présenté une véritable cornichonnerie. Mais le but est atteint : augmenter l’anxiété. Examinons et essayons de comprendre.

L’auteur affirme que pour toutes causes observées, l’excès de mortalité pour 2022 à la mi-juillet en Belgique (en fait au 20 juin), serait déjà de 1.534 décès par rapport à l’ « attendu » que représente, selon lui, la moyenne de décès quotidien des années hors covid 2017-2019. Cet « excès de mortalité » serait imputable au covid (« Tous les pays ne comptabilisent pas leurs morts « covid » de la même manière (…) il existe une autre méthode pour laquelle tous les pays de l’Union ont une comptabilité similaire : le calcul de la surmortalité »).
Il y a deux affirmations dans cet assertion que nous devons examiner — nous ne nous occuperons pas des autres pays, sinon le nôtre; la Belgique. Comme le dit correctement l’auteur de cet article, en comparant un pays à l’autre, on compare le plus souvent des pommes et des poires. Déjà sur la Belgique, il y a du travail…
Première difficulté
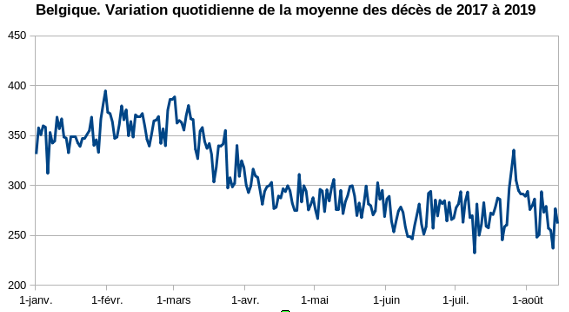
Sauf à trouver le polynôme(1) qui s’adapte au mieux à la courbe dessinée par cette moyenne sur 3 années (2017–2018-2019), on se retrouve avec des incertitudes importantes. Calculer un « attendu » (ce que l’on devrait observer dans une situation dite ‘normale’) en se basant sur seulement trois années introduit une grande variabilité dans la comparaison, comme le graphique ci-dessous nous le démontre. Alors de quoi parle-t-on ?
(Notons que c’est un abus de langage de faire croire que tous les pays de l’Union utilisent sa méthode pour calculer un « attendu » : bien sûr que non, cette tâche est confiée à des personnes compétentes dans ce domaine qui utilisent diverses méthodes.)
Deuxième difficulté
Continuons d’explorer ces données et mettons-les en perspective avec les trois années covid, comparées à la moyenne des 3 années non covid de 2017 à 2019 (représentée par la barre « 0 % »), comme l’auteur de l’article nous le propose.
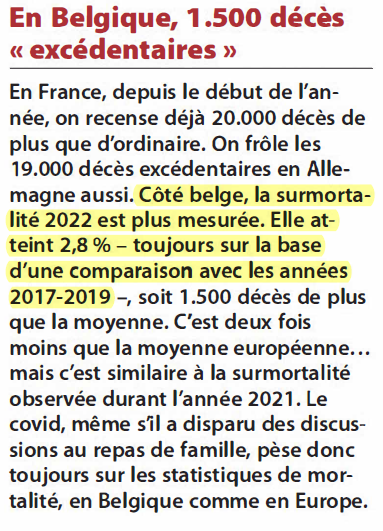
L’auteur de l’article nous explique qu’au 20 juin 2022, les 1.534 décès trouvés en excès (en fait 1.534,7, que j’ai arrondi à 1.535), représentent 2,8 % décès en plus que ce que l’on aurait dû avoir …
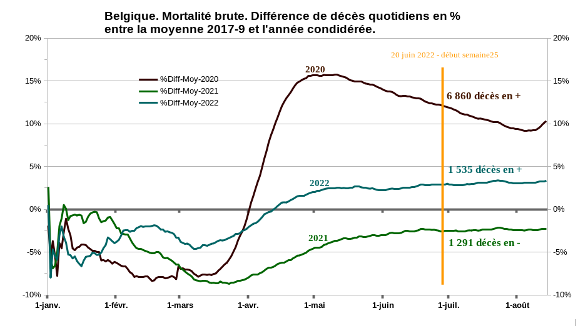
NB : a) Les données de mortalité toutes causes statbel sont actuellement disponibles jusqu’au 14 août 2022. b) La barre 0 % représente la moyenne des trois années 2017–2018-2019 exprimée en %.
En examinant le graphique ci-dessus, plusieurs choses sautent aux yeux :
1. L’année 2021 est en dessous de l’attendu. Cette année soi-disant « covid » se comporte mieux, sur le plan de la mortalité générale (toutes causes), que la moyenne de 3 années non-covid. Dans ce cas, je suppose que l’auteur de cet article, sur base de sa logique, nous expliquera que le covid aura sauvé 1.291 décès au 20 juin 2021 pour l’année 2021 (ou bien restera-t-il pudique comme sciensano avec ses « non détectable » puisque le journaliste affirme faussement que « [l’année 2022] est similaire à la surmortalité observée durant l’année 2021 » ???)
2. Sur base de la moyenne des trois années 2017 à 2019, nous observons une augmentation régulière de la mortalité générale en 2022 à partir de mars, pour, en avril, commencer à développer un excès par rapport à la moyenne proposée (représentée par la barre 0 %). En aucun cas nous ne pouvons déceler dans la forme de la courbe une corrélation avec les pics de l’omicron original, puis omicron-BA2, puis omicron-BA5. Contrairement à 2020, où une partie de l’augmentation peut être raisonnablement attribuée au covid, dans ce cas-ci, il n’est pas possible sur base de ces données de rattacher à omicron l’augmentation observée de mortalité générale par rapport à la moyenne des trois années hors covid.
Explorons cela encore un peu plus en utilisant les données brutes et comparons-les avec les décès attribués au covid par sciensano. Faisons-le pour les années 2021 et 2022. Ici, la barre « 0 » représente la moyenne des trois années 2017–2018-2019.
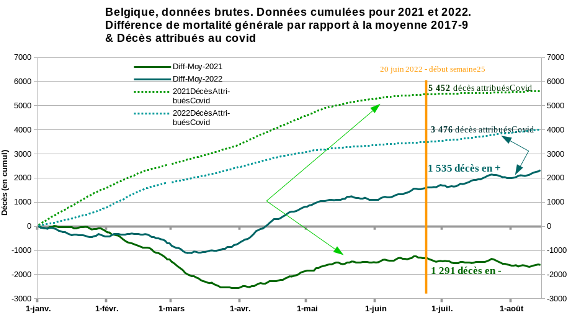
Étonnant, non ? L’année 2021, pour la période considérée, montre une mortalité générale plus basse que la moyenne des trois années hors covid que sont 2017–2018 et 2019, et pourtant, c’est l’année dont la mortalité attribuée au covid, selon Sciensano, est nettement plus importante que celle de 2022.
Ceci a deux conséquences évidentes :
1. L’excès de mortalité toutes causes ne peut absolument pas servir à estimer une mortalité attribuée au covid : NON, ce n’est pas une autre méthode pour calculer « leurs morts covid ».
2. La mortalité attribuée au covid souffre d’excès et pas un peu. (cf « Graphiques 54, point 3 Mortalité »(2))
Bref, l’auteur de l’article de propagande a tout faux. Et c’est peu de le dire.
Troisième difficulté
Explorons les attendus : est-ce fiable ?
Le 14 juin 2021, Sciensano a décidé de modifier ses attendus. Une des raisons invoquées est : « Quelques épisodes de surmortalité, principalement à partir de 2021, seront désormais observés alors qu’ils n’avaient pas été détectés auparavant. ». En d’autres termes, en modifiant les « attendus » vers la diminution, Sciensano, de façon très artificielle et volontaire, va pouvoir déclarer de larges séquences de mortalité observée (réalité) en surmortalité. C’est ce que j’ai appelé dans mes « Graphiques 89 »(3) , ab nihilo, ad nihilum, per vanitatis.
Examinons cela :
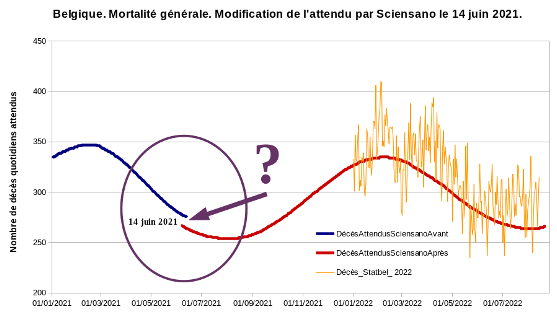
La modification n’est pas petite, elle propose, au 14 juin 2021, une diminution de 11 décès par jour. La conséquence pour 2022 est clairement visible : toute l’année 2022, à peu de choses près, est, selon l’attendu de Sciensano, en surmortalité. Voilà de quoi remonter d’un bon cran l’anxiété de chacun, bravo!
Si Sciensano avait gardé ses anciens attendus, cette farce (je ne trouve pas d’autres mots pour qualifier cela) n’aurait pas eu lieu et des périodes de « surmortalité » plus réalistes auraient été délimitées (en avril par exemple), permettant un réel questionnement de santé publique et le cas échéant une action correctement ciblée.
Décidément, la modélisation des « attendus » est très, trop selon moi, sensible aux manipulations les plus diverses pour être un modèle fiable. Ceci est malheureusement un bon exemple.
Quatrième difficulté
Mais alors que faire ? En Santé publique, les méthodes utilisant un « attendu » sont appelées des méthodes indirectes, précisément parce qu’elles utilisent une modélisation (l’attendu). Mais il existe des méthodes dites « directes », qui comparent simplement les données les unes aux autres, qu’elles soient « standardisées » (le mieux)(4) ou non.
Statbel, dans sa présentation générale(5), propose de nombreux tableaux de comparaison directe de 2017 à 2022. Comme les données sont brutes (ne sont pas standardisées), vous constaterez une tendance quasi imperceptible à l’augmentation des décès d’année en année (sauf l’année 2020 qui est particulière). Et c’est normal, au 1er janvier 2017, nous étions en Belgique 11.322.088 habitants et au 1er janvier 2022, 11.584.008. Mais nous avons également vieilli : l’âge moyen en 2017 est de 41,52 ans et en 2021, de 41,98 ans. L’augmentation de l’espérance de vie compense très partiellement cela. Il est donc normal que l’on meurt un peu plus d’année en année, bien que ce soit peu perceptible.
Ceci étant compris, examinons la mortalité par tranche d’âge (données statbel). Je les présente chaque semaine dans mes « Graphiques »(6), mais cela vaut la peine de s’y pencher dans le cadre de ce travail-ci.
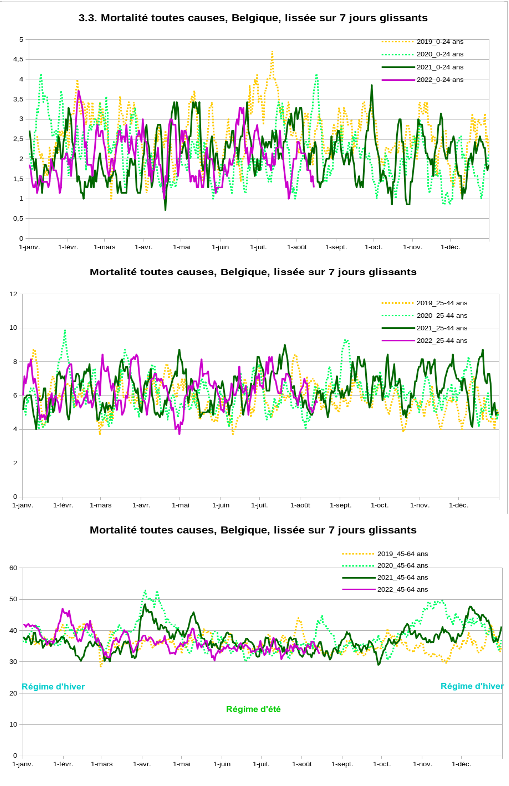
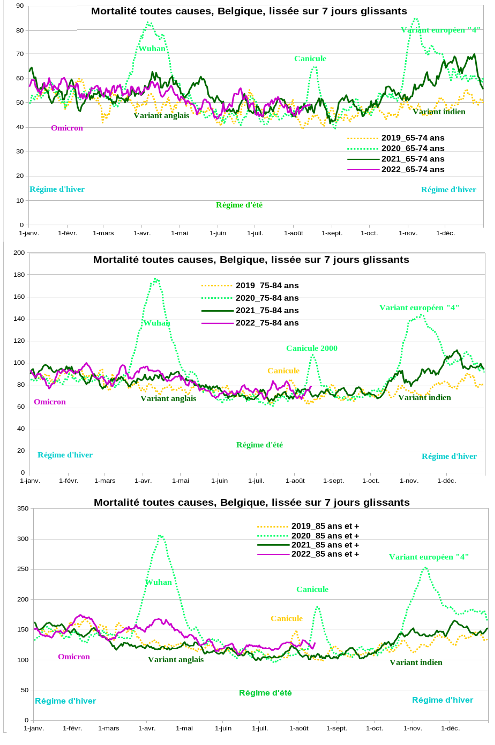
Ces 6 graphiques, par tranche d’âge, comparent 4 années, de 2019 à 2022. Leur examen nous apprend bien de choses.
Mais, dans le cadre de la question traitée ici, nous nous contenterons de relever ceci:
- L’augmentation de mortalité que l’on peut observer en 2022, concerne uniquement la tranche d’âge des 85 ans et plus.
- Parler d’une vraie augmentation de mortalité pour la tranche d’âge des 75–84 ans est limite.
- Concernant les autres tranches d’âge, il n’y a strictement rien.
Qu’est-ce qui peut expliquer cela ? Notons que les 85 ans et plus sont avant tout une population très fragile, souffrant généralement de polypathologies. L’hypothèse du covid meurtrier apparaît peu probable, car c’est la population la plus vaccinée du pays, en ce compris par un deuxième booster, sinon à penser que le vaccin-thérapie génique ne sert à pas grand-chose pour cette tranche d’âge. Et c’est vrai que les données proposées par Sciensano, selon le statut vaccinal, concernant les hospitalisations, l’USI et les décès hospitaliers montrent une efficacité vaccinale largement en berne pour les 65 ans et plus, parfois même une « efficacité » négative ‑un risque accru- (pudiquement dénommé par Sciensano de « réduction relative du risque [suite au vaccin] non détectable »). J’aborde cela, semaine après semaine, dans mes « Graphiques »(7).
Une autre cause hypothétique à cette observation se trouverait dans la nature du vaccin-thérapie génique lui-même et les 85 ans et plus ont en effet reçu tant et plus de ce vaccin-thérapie génique expérimental. Que l’on retienne le vaccin-thérapie génique comme cofacteur de décès chez les personnes très âgées me semble être une hypothèse qui mérite l’attention. Et de ce point de vue, il serait bien intéressant de connaître les nombre de décès dans les 24 et 60 jours après injection. Les Anglais nous avaient proposé ces données, alors pourquoi ne le ferions-nous pas?
Mais évidemment, ce n’est pas parce que l’on observe actuellement une augmentation de mortalité dans la tranche d’âge des 85 ans et plus que l’on peut décréter que, selon certains, c’est évidemment la faute au covid, ou pour d’autres évidemment la faute au vaccin-thérapie génique.
Non, ce n’est pas ainsi que cela fonctionne. La cause est très probablement multifactorielle : c’est l’âge et des infections intercurrentes autres et la tendance au diabète et l’hypertension et la diminution de la capacité immunitaire et l’obésité/alcoolisme/tabagisme et la polypathologie et le vaccin-thérapie génique, et le covid… Dans quelle proportion? C’est évidemment cela qui devrait faire l’objet de recherches rigoureuses.
Conclusion
L’article de ce journal mainstream, placé en première page ‑excusez du peu- qui fut le prétexte à cette analyse se révèle être une construction mensongère, un fake, chargé d’angoisse et de peur. Nous n’avons actuellement vraiment pas besoin de cela en plus de tout le reste(8). Sur base de chiffres détournés de leur réelle signification, la construction intellectuelle qui en est proposée est fausse de « A à Z ». C’est d’ailleurs assez étonnant qu’un journal mainstream, qu’on lisait autrefois pour la qualité des informations avancées, pour l’apparence de contre-pouvoir qu’il présentait, puisse proposer de telles niaiseries. Mais finalement est-ce tellement étonnant ? La presse mainstream d’aujourd’hui a abandonné depuis longtemps son rôle de garde-fou, de critique de l’autorité, a fortiori de « quatrième pouvoir » et de garant de la liberté d’expression. Elle s’est transformée en propagandiste intransigeant du narratif, un récit parallèle aux réalités que nous vivons, dont nos « élites » (au sens de Maffesoli : « ceux qui ont le pouvoir de dire et le pouvoir de faire ») nous abreuvent. L’une et l’autre sont co-responsables de cette distanciation sociale, cet abyme qui se creuse entre l’ « élite » et le peuple et qui annonce des temps incertains. Triste et dangereux.
Christophe de Brouwer
Full-professeur honoraire et ancien président de l’École de Santé publique de l’Université libre de Bruxelles.
- Un polynôme en la variable x est une somme dont les termes sont les produits de puissances entières positives ou nulles de la variable x par des nombres réels. Les facteurs réels de ces produits sont appelés les coefficients du polynôme.
- https://graphiques-belgique.over-blog.com/2021/12/covid-belgique-graphiques-54-deuxieme-annee-17-decembre-2021-semaine-50.html
- https://graphiques-belgique.over-blog.com/2022/08/covid-belgique-graphiques-89-deuxieme-annee-19-aout-2022-semaine-33.html
- https://www.researchgate.net/publication/359135380_Taux_de_mortalite_standardise_en_Belgique_2021_Standardized_Mortality_Rate_in_Belgium_2021?channel=doi&linkId=6229ddc997401151d20ba978&showFulltext=true
- https://statbel.fgov.be/fr/propos-de-statbel/que-faisons-nous/visualisations/mortalite
- https://graphiques-belgique.over-blog.com/
- https://graphiques-belgique.over-blog.com/
- https://www.levif.be/opinions/cartes-blanches/combien-de-personnes-mourront-cet-hiver-faute-davoir-pu-se-chauffer-carte-blanche/